Note: this blog post will display far better on a desktop browser
On Sunday evening, we opened a survey on remote assessments during the COVID-19 pandemic. We wanted to find out how people felt about plans to move to remote time-restricted assessment, and about potential alternative options. In just 48 hours, we had 6,940 responses - about half of all taught students. Thank you to everyone who filled it in and helped share it. We've made a short report on the results of the survey, and have distributed as much of the raw results as we can (considering GDPR compliance) with the reps.
1. Difficulties and timezones
From what we've heard from students over the last few weeks, there were 3 key expected difficulties that students are concerned about. We asked respondents to indicate if they expected to have either of these difficulties up until the end of the term.
| Difficulty | Percentage of students |
|---|---|
| Difficulty finding a quiet space to work | 54.3 |
| Having childcare or other caring responsibilities | 10.2 |
| Difficulty accessing technology needed to study and/or take exams | 31.8 |
| None of the above | 31.0 |
| Prefer not to say | 4.8 |
Over 64% of students indicated they'd expect to have at least one of these issues, with over half saying they would have difficulty finding a quiet space to work and nearly a third with difficulty to access technology. Clearly, the move to remote working and the current global situation is affecting a large number of student's ability to study.
We also asked students to indicate what timezone they expect to be in during their exam period to get a sense of where everyone is located now, and how big the issue of students taking exams at silly times will be. The distribution of results is shown below.
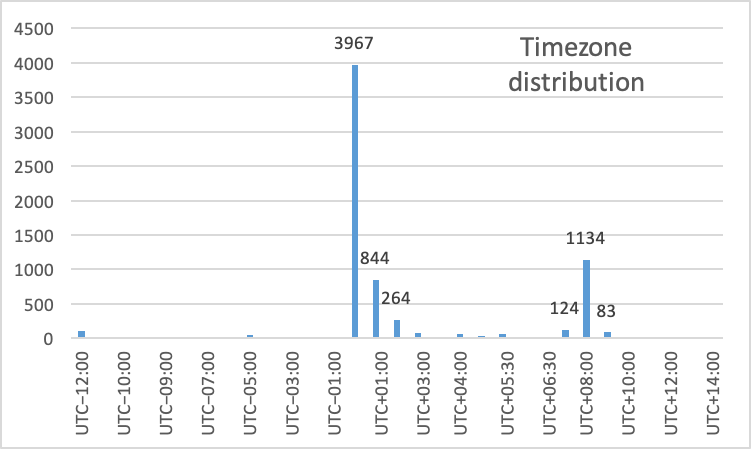
A majority of students (57%) are still in a London timezone, with 39% in a timezone ahead, and 4% in a timezone behind. The main clusters are in Western Europe, and Eastern Asia. There is a degree of good news here, as it seems not many students will need to be waking up extremely early to take exams (as this is mainly a worry for students on an earlier timezone). Departments are allowed to move their exam times by 5 hours, so hopefully students doing exams at silly hours can be mostly minimised.
2. Comfort with current form of assessment
We asked students to indicate, on a scale of 0-10 where 0 is 'Not at all comfortable' and 10 is 'Extremely comfortable', how comfortable they are with the current plan of remote assessment, and how comfortable they would be with the current plan plus a 'no detriment/safety net' policy. Such a policy would likely mean that, as long as a student has met the requirements necessary to pass, they will achieve at least the average mark they were on from all assessments up until the College closure due to COVID-19. Naturally, there would have to be exceptions where there isn't prior assessment to judge off.
The table below summarises the current comfort, the comfort with a safety net and the percentage of students who would feel at least or more comfortable with a safety net. It's split by department and also includes the percentage of students who indicated an expected difficulty.
| Department | Number of responses | % with expected difficulties | Comfortable now avg. rating | Comfortable w/ safety net avg. rating | % as or more comfortable with safety net |
|---|---|---|---|---|---|
| Aeronautics | 360 | 61% | 4.67 | 7.58 | 90% |
| Bioengineering | 437 | 63% | 4.69 | 7.86 | 93% |
| Business School | 422 | 72% | 4.32 | 8.25 | 91% |
| Centre for Environmental Policy | 14 | 71% | 5.64 | 8.57 | 100% |
| Chemical Engineering | 502 | 70% | 4.59 | 7.54 | 92% |
| Chemistry | 372 | 62% | 4.97 | 7.99 | 93% |
| Civil and Environmental Engineering | 300 | 68% | 4.83 | 7.32 | 90% |
| Computing | 388 | 51% | 5.74 | 7.90 | 87% |
| Design Engineering | 116 | 59% | 5.28 | 7.72 | 91% |
| Earth Science and Engineering | 279 | 66% | 3.85 | 7.45 | 92% |
| Electrical and Electronic Engineering | 361 | 58% | 4.04 | 7.23 | 91% |
| Life Sciences | 490 | 70% | 4.25 | 7.47 | 92% |
| Materials | 240 | 66% | 4.78 | 7.79 | 88% |
| Mathematics | 621 | 58% | 4.75 | 6.98 | 88% |
| Mechanical Engineering | 513 | 70% | 4.75 | 7.69 | 91% |
| Medicine (MBBS) | 561 | 61% | 5.32 | 7.23 | 87% |
| Medicine (other) | 204 | 69% | 4.91 | 7.68 | 93% |
| Physics | 754 | 73% | 3.35 | 7.61 | 93% |
| Other | 6 | 67% | 4.17 | 7.50 | 83% |
| Grand Total | 6940 | 65% | 4.58 | 7.58 | 91% |
On average across all departments, students reported a comfort level of 4.58 with the current plan which increased to 7.58 when considering a safety net policy. In every department (both with undergraduates and taught postgraduates), a vast majority of students would feel at least as comfortable (91%) and more comfortable (78%) with a no detriment/safety net policy. The average difference in comfort levels does vary across department: the largest increases in comfort came from Physics (4.3) and the Business School (3.9), and the smallest increases from Medicine MBBS (1.9) and Computing (2.2).
3. Disparities in comfort levels
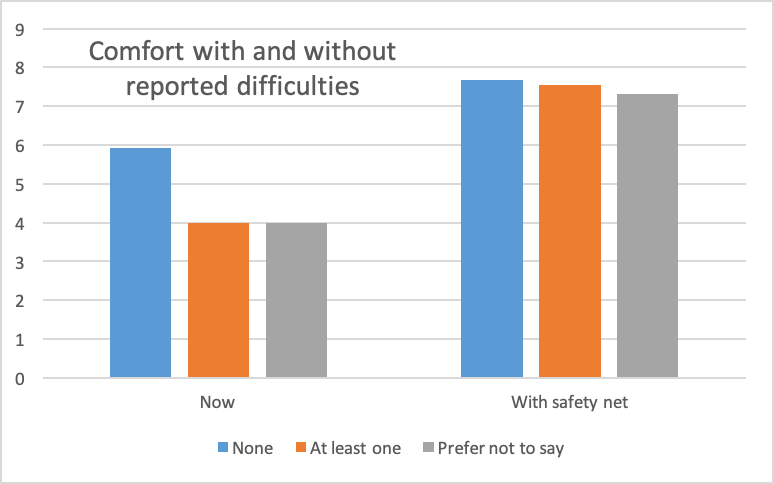
We've compared the comfort levels of students who reported to have one of the difficulties listed in section 1, compared to those who didn't report an expectation to experience any of these difficulties - the results are summarised in the graph below. A large disparity in current comfort levels can be seen between those who didn't report any difficulties (5.9) and those who reported at least one (4.0), as well as those who preferred not to say (4.0 also). These all leveled out and the disparity nearly completely disappears when adding in a no detriment/safety net policy to 7.7 for those with neither difficulty, 7.5 for those who reported at least one and 7.3 for those who preferred not to say.
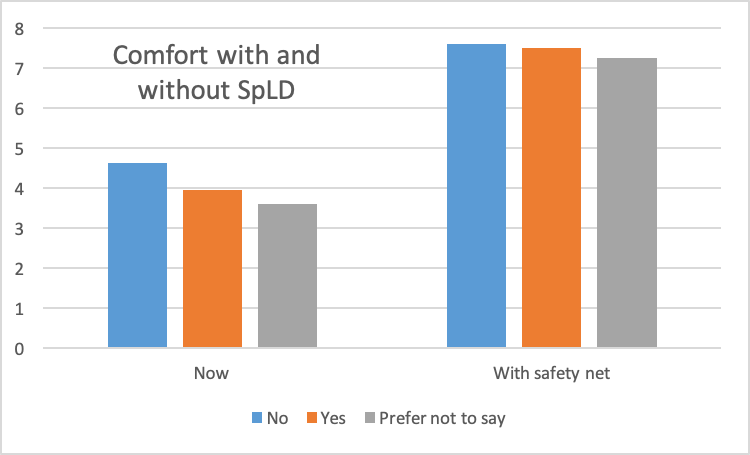
A similar, but less stark, effect is seen with students reporting specific learning difficulties (SpLD). With the current plan, those who reported to not have an SpLD felt a comfort level of 4.6 whereas those who reported one a level of 3.9 (and those who preferred not to say 3.6). With a no detriment/safety net policy, the disparity in these scores narrow significantly becoming 7.6, 7.5, and 7.2 respectively.
4. Alternative forms of assessment
We also asked students to indicate which alternatives to remote, time-restricted assessments they would prefer to the current plan (without a no detriment/safety net policy). Three options were given - chosen as a representative of other forms being used across the sector - and students could choose as many as they wish, and also write an option themselves if they wanted. The table below summarises the result.
| Alternative | % preferred |
|---|---|
| Replacing timed exams with coursework (a take home exam) that would be completed over a long (day or short number of days) period | 58.3 |
| Cancelling as many exams as possible (within external regulations), and progress/graduate students using alternative forms of assessment | 35.1 |
| Cancelling as many exams as possible (within external regulations), and progress/graduate students based on already ascertained information | 37.5 |
| None of these | 16.6 |
| Other (write in) | 6.7 |
The option that more students would prefer was replacing timed exams with coursework - 58.3% indicated this would be a preferred option. 16.6% thought no other option was preferable, and 6.7% wrote in an alternative. Probably the most popular written in alternative was to postpone exams by a few weeks or until autumn.
Conclusions
What does it all mean? I think there are 4 key conclusions to draw:
1. A majority of students will experience difficulties that will impact their ability to study and/or take remote exams - this will likely lead to a vast number of mitigating circumstance cases.
2. There is general discomfort with the current plan for assessment, and most students would prefer something different to happen.
3. The current form of assessment causes more discomfort for students facing certain difficulties compared to those who have said they won't face these.
4. There is a mixed response to what alternative assessments could be taken, so the implementation of a no detriment/safety net policy with the current form of assessment would be preferred by a greater number of students than any alternative form of assessment (78% are more comfortable with this policy whereas 58% would prefer the most popular alternative assessment).