

Step-by-Step
The voting period for this year's Leadership Elections differs from the previous year and is highlighted in each of the graphs below.
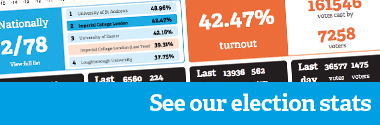
The above graph shows the total number of votes cast in each 5 minute period, while the below graph show the number of new voters.
The final graph shows the cumulative number of voters versus the previous year, allowing you to see whether we're ahead or behind.
